Notes on Python#
Efficiency in Python#
In standard Python implementations, thread safety is managed utilizing a Global Interpreter Lock (GIL). This ensures that while a process can be multi-threaded and multiple threads can run concurrently, no two threads of the same process ever execute Python bytecode at the exact same time.
The GIL effectively eliminates the risk of race conditions within the interpreter, but it restricts the process to advancing only a single thread at any given moment. A critical consequence of this architecture is that CPU-intensive tasks executed purely in Python do not benefit substantially from multi-threading.
Conversely, tasks reliant on external controllers, such as I/O operations or network traffic, can still benefit significantly from a multi-threaded implementation. The waiting periods inherent in these operations are utilized to advance other threads, thereby increasing overall efficiency even on single-core architectures.
Slow & Popular#
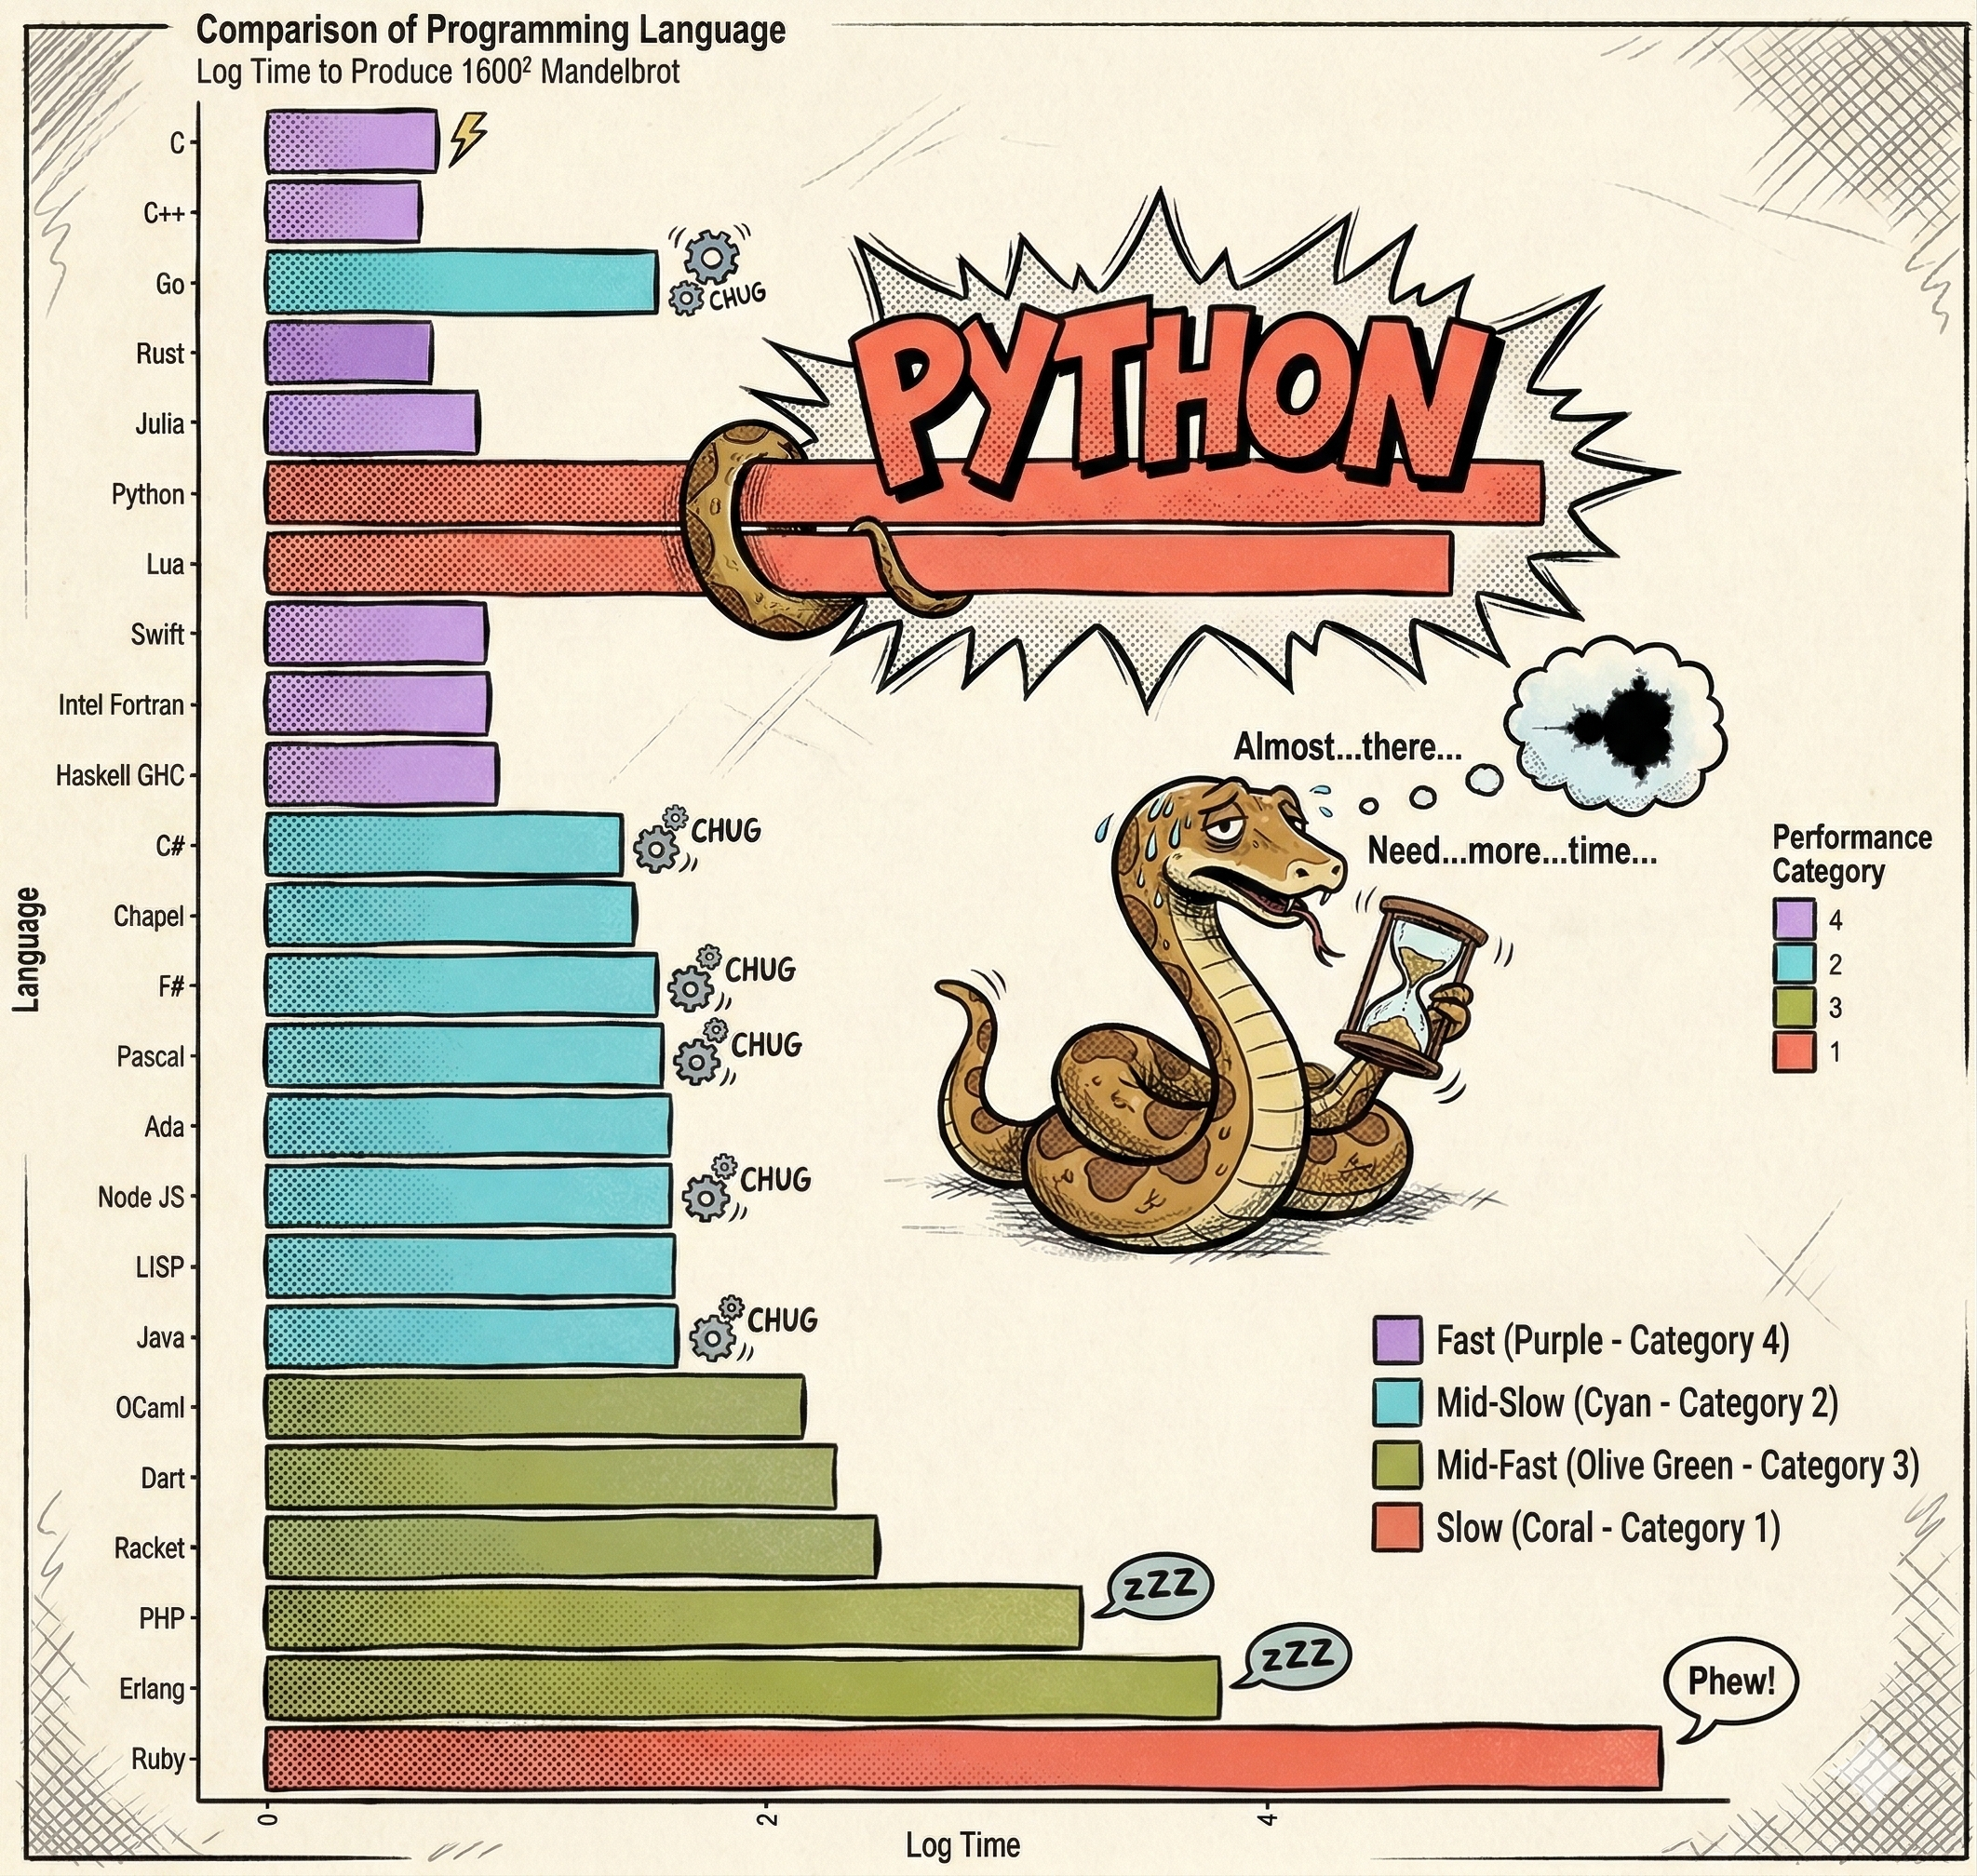
Adapted from https://commons.wikimedia.org/wiki/File:Barplot_language_speeds_(Benchmarks_Game_Mandelbrot).svg
.svg)
When evaluating computational efficiency, the inherent execution speed of the language must be considered. Python is significantly slower than compiled languages.
Despite this, Python remains the dominant language for data science and computationally intensive tasks.
Python’s Elephant in the Room#
Its prevalence is not due to methodologies being implemented in pure Python, but rather because Python provides a comprehensive portfolio of interfaces to highly effective implementations.
Libraries such as pandas (built upon numpy), scipy, scikit-learn, pytorch, and tensorflow act as abstraction layers, providing a Python interface to highly optimized C, C++, or Fortran libraries.

Carrying out a computational project in Python effectively means orchestrating the computation. The Python script serves as a facade, while the actual computational workload is executed by compiled code.
Gotcha 1: Parallelization#
When Python is utilized to orchestrate computational workloads, an additional layer of complexity is introduced, as the Python process often executes compiled code.
This behavior can be observed by monitoring system resources while executing a standard matrix operation:
import numpy as np

size = 4000
arr1 = np.random.rand(size, size)
arr2 = np.random.rand(size, size)

for _ in range(100):
    np.dot(arr1, arr2)
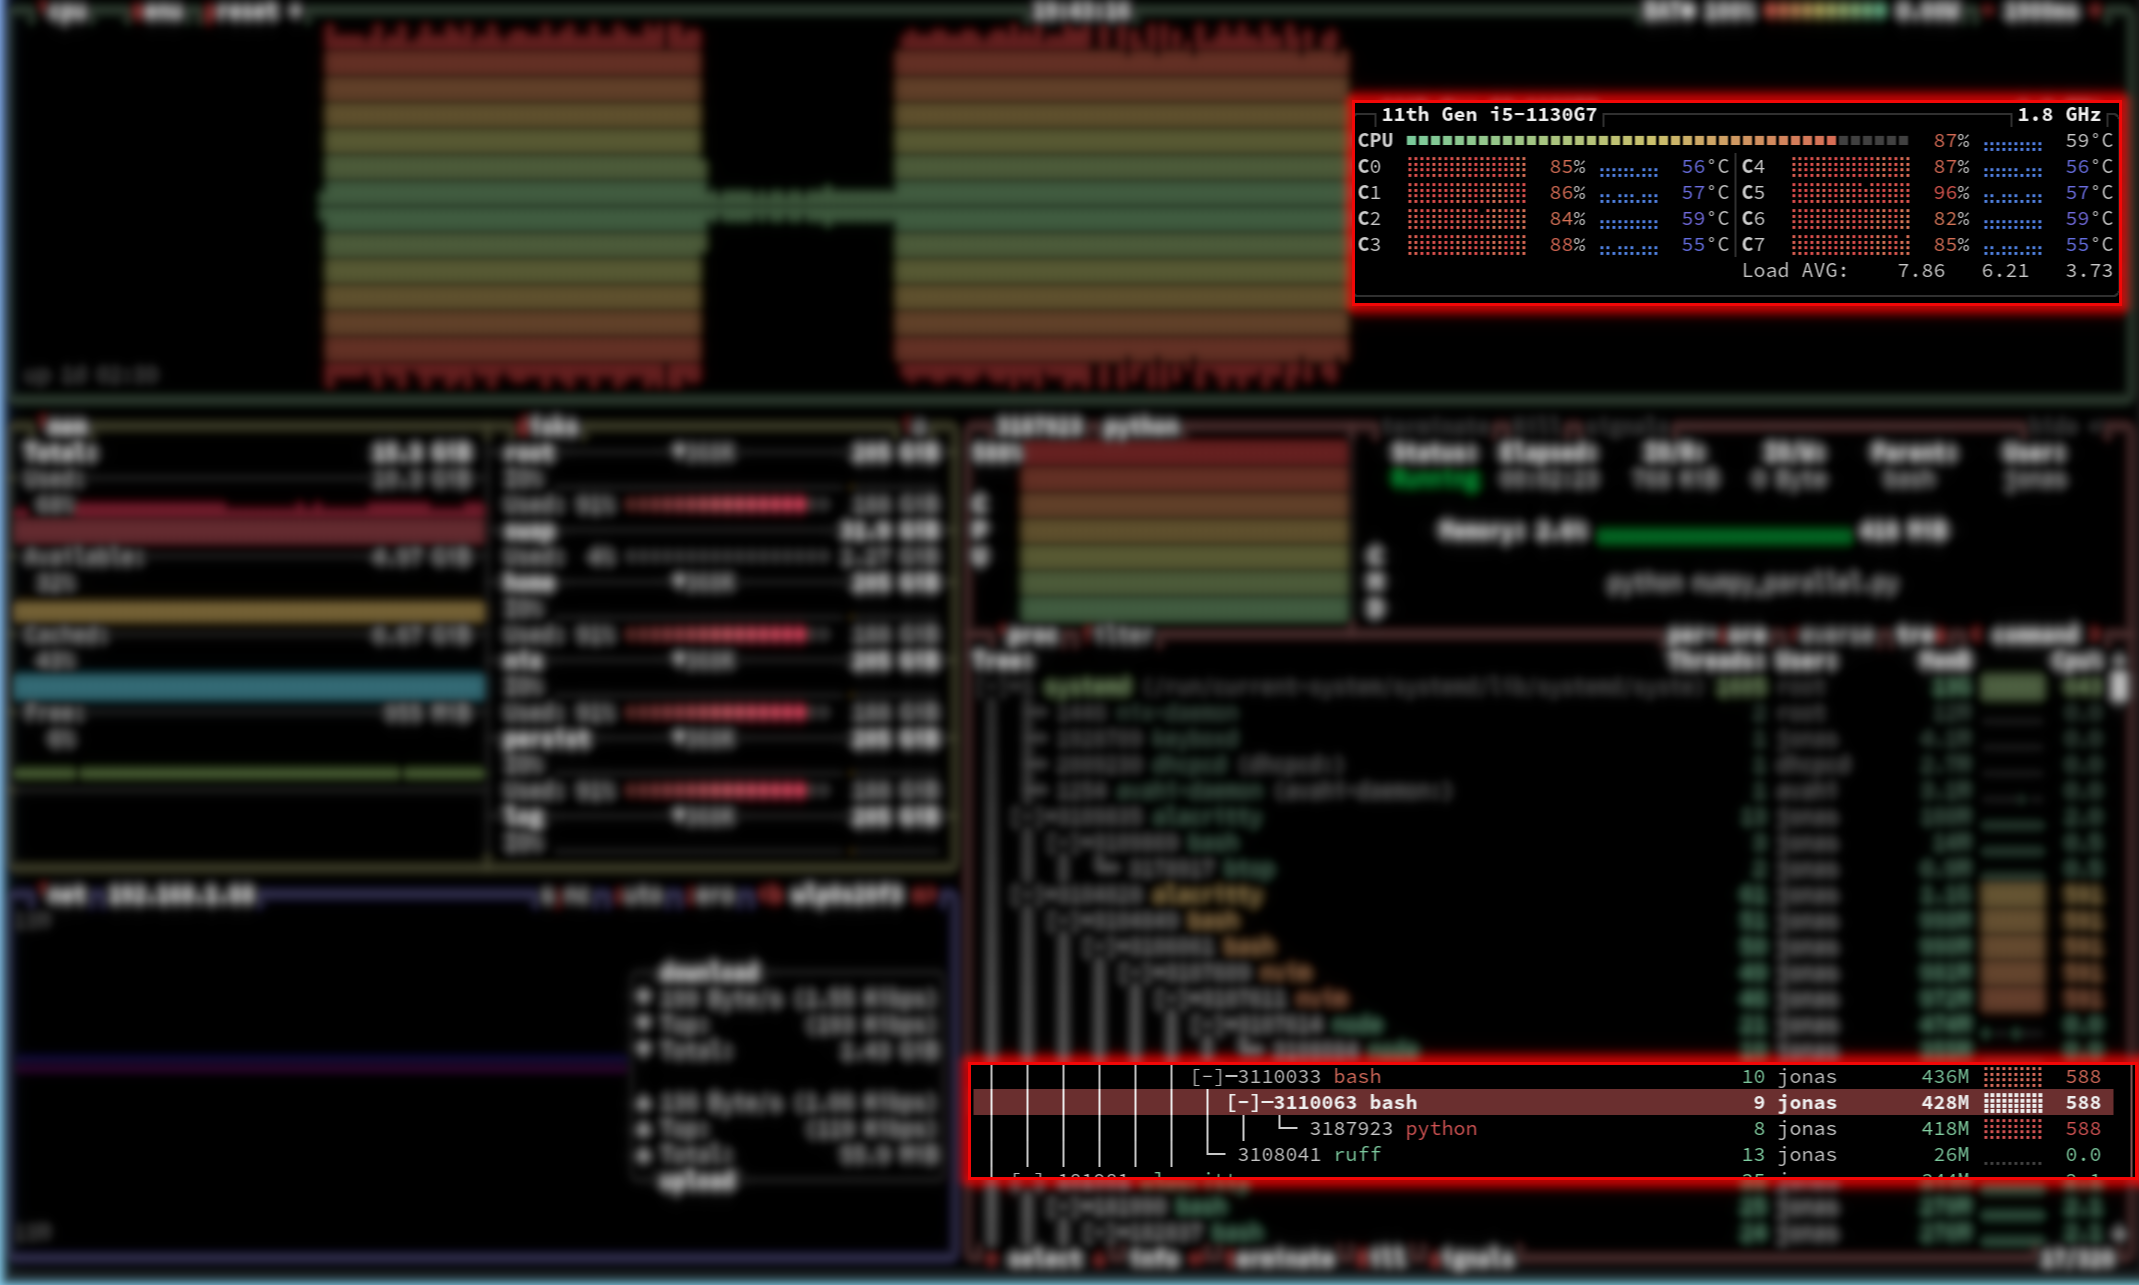
⚠️ The Oversubscription Risk:
Naively parallelizing a Python loop over operations that are already internally parallelized leads to severe thread contention and drastic performance degradation.
On a Unix-based system, resource monitors (such as btop) will reveal that a single Python process effectively utilizes all available CPU cores.
This occurs because libraries like NumPy utilize highly optimized C frameworks (such as BLAS) for algebraic operations. When the Python process invokes the dot product, the implementation saves its state, explicitly releases the Global Interpreter Lock (GIL), and delegates the task to the compiled C code. The C code then executes a multi-threaded, parallel computation utilizing all available hardware cores. Upon completion, the Python thread is restored, the GIL is reacquired, and standard execution resumes.
Attempting to explicitly parallelize the outer Python for-loop in this scenario is highly counterproductive. If parallelized, each individual Python task would trigger the underlying C library to spawn its own set of threads across all CPUs. This results in a scenario where every CPU runs multiple processes, each attempting to spawn threads across all CPUs simultaneously. This phenomenon, known as oversubscription or thread contention, leads to massive context-switching overhead and a drastic reduction in execution speed.
Consequently, writing efficient code in high-level orchestration languages (including Python and R) requires a fundamental understanding of the dependencies utilized and their specific internal execution models.
Gotcha 2: Context Switches#
Another complicating factor must be considered when Python scripts act as an orchestration facade for computational workloads. Instructions and data must be translated between high-level Python objects and the low-level data structures required by the underlying compiled languages.
These translations consume considerable memory and computational time. Performance bottlenecks in scripts utilizing packages like numpy, tensorflow, or pytorch are frequently linked to poor management of these data structure transitions.
To illustrate the impact of data transitions, consider the following benchmark comparing different summation methods:
import numpy as np
import time

def timeit(func, iterations=100, *args, **kwargs):
    """Measure overall duration of a repeated function call."""
    start_time = time.perf_counter()
    for _ in range(iterations):
        func(*args, **kwargs)
    end_time = time.perf_counter()
    print(f"{iterations} calls of {func.__name__}:\t"
          f"{round(end_time - start_time, 3)} seconds")

def numpy_sum(np_array):
    """Use numpy's built in sum."""
    return np.sum(np_array)

def python_loop(collection):
    """Use conventional python loop to sum an array or list."""
    python_sum = 0
    for num in collection:
        python_sum += num
    return python_sum

def python_sum(collection):
    """Use python built-in sum function."""
    return sum(collection)

# Create a large NumPy array
np_array = np.random.rand(1000000)
# Create a conventional python list
conventional_list = np_array.tolist()

print("NumPy array:")
# Calculate the sum using NumPy's built-in function
timeit(numpy_sum, 100, np_array)
# Calculate the sum using a Python sum
timeit(python_sum, 100, np_array)
# Calculate the sum using a Python loop over the NumPy array
timeit(python_loop, 100, np_array)

print("Python list:")
# Calculate the sum using a Python's sum
timeit(python_sum, 100, conventional_list)
# Calculate the sum using a Python loop over the conventional list
timeit(python_loop, 100, conventional_list)
An exemplary output demonstrates the severe performance disparity:
NumPy array:
100 calls of numpy_sum:    0.041 seconds
100 calls of python_sum:   6.120 seconds
100 calls of python_loop:  6.926 seconds
Python list:
100 calls of python_sum:   0.748 seconds
100 calls of python_loop:  2.122 seconds
Performance Analysis:
Pure C Execution: Utilizing
numpy_sumon a NumPy array yields the highest performance. No computation is performed in Python; the script simply formulates instructions for the optimized C backend.Pure Python Execution: Operating on standard Python lists (
python_sumandpython_loop) is inherently slower due to the interpreted nature of the language. However, the built-insum()function exhibits optimization compared to a manual loop.Cross-Boundary Execution (The Bottleneck): The most inefficient operation observed is utilizing a Python
for-loop to iterate over a NumPy array. This takes over 100 times longer than the pure NumPy implementation, and significantly longer than looping over a standard Python list.
This severe degradation occurs because the for-loop forces the continuous conversion of each C-level data element within the NumPy array into a standard Python object before performing the addition. The reason this version is slower than the equivalent pure Python loop is precisely the overhead of the data conversion from C to Python.
While isolated in this benchmark, identifying mismanaged transitions between Python and compiled extensions in complex codebases is a primary requirement for performance optimization.
Profiling and Debugging#
Developing efficient parallel code requires more than just distributing work across processors. Understanding where your code spends its time and identifying issues are critical skills for producing high-quality, performant software.
Before attempting to parallelize code, you should understand its performance characteristics:
Where is time spent? Computation, I/O, memory allocation, or communication?
What are the bottlenecks? Identifying the 20% of code consuming 80% of runtime
Is parallelization appropriate? Some bottlenecks (I/O, single-threaded libraries) won’t benefit from parallelization
Key principle: Profile before optimizing. Intuition about performance is often wrong. Data-driven decisions prevent wasted effort.
Profiling Tools for Python#
Python offers several profiling approaches, each suited to different scenarios:
Ad-hoc Timing#
For quick measurements of specific code blocks:
import time

start = time.perf_counter()
# Code to measure
result = expensive_function()
elapsed = time.perf_counter() - start
print(f"Execution time: {elapsed:.3f} seconds")
When to use: Quick checks, comparing alternatives, timing specific functions
Deterministic Profiling with cProfile#
The standard library’s cProfile provides comprehensive statistics:
import cProfile
import pstats

# Profile a function
profiler = cProfile.Profile()
profiler.enable()
your_function()
profiler.disable()

# Print results
stats = pstats.Stats(profiler)
stats.sort_stats('cumulative')
stats.print_stats(20)  # Top 20 functions
Or profile an entire script from the command line:
python -m cProfile -s cumulative your_script.py > profile_output.txt
When to use: Understanding overall program performance, identifying hot spots across the entire call stack
Line-by-Line Profiling#
line_profiler provides granular timing for each line in a function:
pip install line_profiler
# Add @profile decorator (no import needed)
@profile
def your_function():
    result = []
    for i in range(1000):
        result.append(expensive_operation(i))
    return result
kernprof -l -v your_script.py
Output shows time spent per line, making it easy to identify specific bottlenecks.
When to use: Understanding performance within a specific function, identifying which lines are slowest
Memory Profiling with memray#
memray tracks memory allocations with minimal overhead:
pip install memray
# Profile memory usage
memray run your_script.py

# Generate flamegraph visualization
memray flamegraph memray-output.bin
For pytest integration:
pip install memray pytest-memray
pytest --memray tests/
When to use: Identifying memory leaks, understanding memory allocation patterns, optimizing memory-intensive workflows
Debugging Parallel Code#
Debugging introduces additional challenges when code runs in parallel:
Race conditions may appear intermittently
Output from multiple processes can interleave
Breakpoints in parallel contexts require careful handling
Types of Bugs#
Nice Bugs cause immediate, obvious failures with clear tracebacks. These are relatively easy to fix once you understand how to read Python tracebacks. The Real Python traceback tutorial is an excellent resource.
Nasty Bugs produce incorrect results without crashing, or cause errors far downstream from the actual problem. These require systematic debugging.
Systematic Debugging Process#
Identify the bug: Confirm the behavior is genuinely wrong, not just unexpected due to input data variations
Reproduce consistently: Create a minimal test case that reliably triggers the bug. Ideally, write a unit test that fails.
Locate the source: Determine where logic diverges from expected behavior. Options include:
Adding diagnostic output (prefer logging over print statements)
Using interactive debuggers to inspect state
Binary search: comment out sections to isolate the problem
Fix and verify: Apply the fix, confirm it resolves the issue, and ensure no regressions
Debugging Tools#
Python’s logging module: Prefer structured logging over print statements:
import logging

logging.basicConfig(level=logging.DEBUG)
logger = logging.getLogger(__name__)

def process_data(data):
    logger.debug(f"Processing {len(data)} items")
    result = complex_operation(data)
    logger.info(f"Completed processing, result size: {len(result)}")
    return result
Benefits:
Control verbosity with log levels
Timestamps and source location automatically included
Can redirect to files or external systems
Works well in parallel contexts (each process can log independently)
Interactive debugging with ipdb: ipdb provides an enhanced debugging interface:
pip install ipdb
Insert breakpoints in your code:
def problematic_function(data):
    processed = initial_processing(data)

    import ipdb; ipdb.set_trace()  # Execution pauses here

    result = further_processing(processed)
    return result
When execution reaches the breakpoint, you get an interactive prompt to:
Inspect variables:
print(processed)Execute code:
len(processed)Step through execution:
n(next),s(step into),c(continue)View source context:
l(list)
IDE debugging: Most modern IDEs (VS Code, PyCharm, Spyder) provide graphical debuggers with:
Visual breakpoint setting
Variable inspection panels
Step-through controls
Conditional breakpoints
Debugging Parallel Code Specifically#
Challenges:
Multiple processes produce interleaved output
Debuggers may not attach to child processes automatically
Non-deterministic timing can hide bugs
Strategies:
Test sequentially first: Debug your logic with serial execution before parallelizing
Use process-safe logging:
import multiprocessing
import logging

def worker(task_id):
    logger = multiprocessing.get_logger()
    logger.info(f"Worker {task_id} starting")
    # Work here
    logger.info(f"Worker {task_id} completed")
Reduce parallelism during debugging: Test with 2 processes instead of 20 to simplify output
Add deterministic checks: Validate intermediate results within each process
Best Practices#
Isolate profiling types: Don’t run memory and timing profiling simultaneously—overhead from one distorts results from the other.
Establish baselines: Profile before optimization to establish baseline performance. This enables measuring improvement objectively.
Profile realistic workloads: Use representative data sizes and problem complexity. Toy examples may not reveal actual bottlenecks.
Automate profiling: Integrate profiling into CI/CD pipelines to detect performance regressions early.
Document expectations: Add comments noting expected performance characteristics. Deviations signal potential issues.
Further Resources#
Tip
Integration Testing for Parallel Code: Write tests that verify not just correctness but also expected speedup. If 4 processes don’t provide ~4x speedup for an embarrassingly parallel problem, investigate why.
Primer on Parallelism#
Parallelism lets you handle resource-intensive and data-heavy computations. This section covers the basics: what parallelism is, where it happens, and how to implement it (in Python).